So I’ve had a 400W solar panel setup for almost a year now. I’ve been powering an inverter, DSL router, and some 12V LED strip lights. But now that I want to expand the system, I have to justify it by measuring its current performance and determining which parts of the system need to be expanded. Panels? Batteries? Wire gauge? Controllers? Everything?
A few years ago I bought a Raspberry PI 2 B kit that included a case, WiFi dongle, and SD card from CanaKit. Over Christmas break I searched for a PI-compatible analog to digital converter and found that the ADS1115 breakout from Adafruit was very popular. It has four single-ended (or two differential) analog inputs at 16 bits signed with a programmable gain. Very versatile, and if I later on want to measure currents by voltage drops over a small shunt resistance, it has the gain to do that. (Though I haven’t yet.)
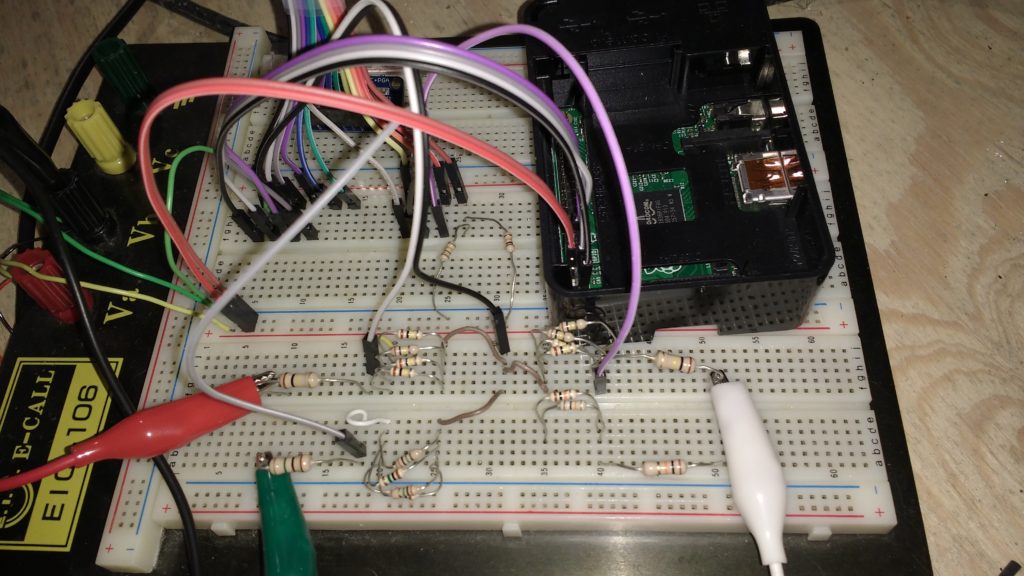
So I wired up the ADS1115 off of the I2C pins on the Raspberry PI I/O header. I’m using the 3.3v provided by the Raspberry PI and powering the Raspberry PI with the USB 5V output from the VicTec controller. Very handy. The Adafruit site has a great guide on doing this.
https://learn.adafruit.com/raspberry-pi-analog-to-digital-converters/ads1015-slash-ads1115
The solar charge controller charges the battery at up to 14.1v, and the ADS1115 can only handle up to 3.3v. So I have to divide the voltage down by about 1/5 before I can put the voltage on the input to the A/D. After consulting an online resistor voltage divider calculator, and shooting for low current (but not too low to be overly sensitive to noise), I found that I don’t have 25k and 100k resistors. But I DO have a bunch of resistors in the 100k-ohm range that all have the same value. If I put four of those in parallel and one in series, I get the appropriate 4:1 resistance ratio to get 1/5th of the voltage across the solo series resistor. So I did. Sorry, enough geeking out.
I put that all together, with:
– channel 0 on the battery
– channel 1 on solar string 1
– channel 2 on solar string 2
– channel 3 on a 1/2 voltage divider of the 5V from the USB

Ssh’d into my Raspberry PI. It took a while to remember the username and password that I had set up, then I followed the Python code library installation instructions from Adafruit and etc on the internet:
sudo apt-get install python-smbus
sudo raspi-config
sudo i2cdetect -y 1
sudo apt-get install git
git clone https://github.com/adafruit/Adafruit_Python_ADS1x15.git
cd Adafruit_Python_ADS1x15/
sudo python setup.py install
sudo pip install adafruit-ads1x15
sudo apt-get install python-dev
sudo apt-get install python-smbus
sudo python setup.py install
In the examples directory of the adafruit library is a great starter piece of code. I tested the example and got some realistic numbers coming back. Just a quick note: The ADS1115 is 16 bit signed, so you lose one bit for the sign. This will be helpful, though, if you want to measure negative voltages (like current flowing in vs out of your battery bank!) So the maximum voltage (with the gain set to 1) is 4.096v which is represented by an ADC value of 2^15 = 32768. My circuit uses a 1/5th voltage divider. To get the voltage of my solar panels, the equation is:
SolarPanelVoltage = adc.read_adc(channel, 1) * 5 * 4.096 / 32768
Yay! Data! Now I hate copying and pasting from SSH, and I need a long-term data presentation system, so I decided to pump this data into a text file and serve it up on the raspberry PI webserver. Very easy actually. Yay Python!
today = datetime.now().isoformat()
ymd = str(datetime.now().year) + str(datetime.now().month) + str(datetime.now().day)
filename = ‘/home/pi/www/solarlog-‘ + ymd + ‘.txt’
# Print the ADC values.
text = today + ‘\t’ + “{0:.2f}”.format(SolarPanelVoltage) + ‘\n’
#print(text)
f = open(filename, ‘a’)
f.write(text)
f.close()
With the above code in an infinite loop and a 10 second delay (time.sleep(10)), we’re in business. Of course, raw data is unreadable, so I’d rather plot it in a pretty chart. Quick internet search reveals http://matplotlib.org/, a great, quick, easy, simple, powerful plotting library for Python.
sudo apt-get install python-matplotlib
So I wrote a quick Python program that reads in my solar data log, converts the data into floats, stuffs the data into arrays, and plots the resulting lines.
for row in file:
v1.append(float(row[1]))
v2.append(float(row[2]))
v3.append(float(row[3]))
n.append(float(rownumber))
rownumber = rownumber + 1
# Make a square figure and axes
v1h = plt.plot(n, v1, label=’Battery’)
v2h = plt.plot(n, v2, label=’Panels 1′)
v3h = plt.plot(n, v3, label=’Panels 2′)
title(‘Solar Panel Voltage\n’ + startTime + ‘ – ‘ + endTime)
plt.legend(loc=’upper left’)
plt.ylabel(‘Volts’)
plt.xlabel(‘Time’)
savefig(imagefilename)
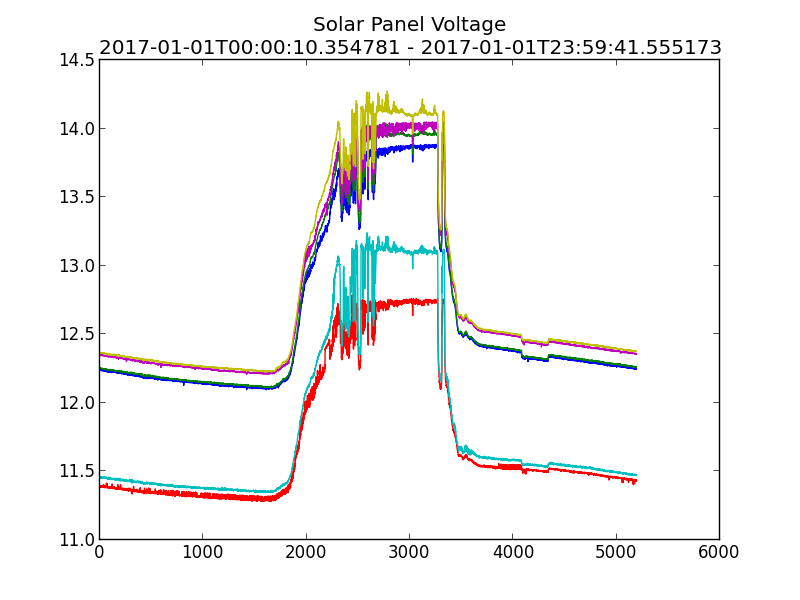
I left the house and the data collection alone to spend the New Year’s with my family and another family up in Iowa City. We sang kareoke in the basement and I drank way too much Fireball. Spent the next day sick as a dog. And Ta Da! I have a solar voltage graph!

Which makes no sense whatsoever! What do these voltages mean!? Why did I forget to calibrate!? So I calibrated. I went back into the cellar where I keep this setup and rewired all inputs to zero volts and let the data collect a few samples. Then connected them to my 5V USB input for a few samples and also measured with my multi-meter (actually 4.7V). Then I connected them all to the battery and collected a few samples and measured with my multi-meter (about 12v). Then, coming back to the laptop, pulled up the sampled data and calculated my calibrations. They were all spot-on at zero volts, which means that there was no offset error of the voltage. They were all different at 5v and even more different at 12v. Well, that makes sense- my voltage dividers were cobbled together and were’t very precise. So my error is in the voltage divider, which is a scaling error. Easy to fix! Divide by the logged value, multiply by the measured value:
# manual calibration of v1, v2, v3
v1c = (v1c * 12.6) / 12.31
v2c = (v2c * 12.6) / 11.61
v3c = (v3c * 12.6) / 12.41
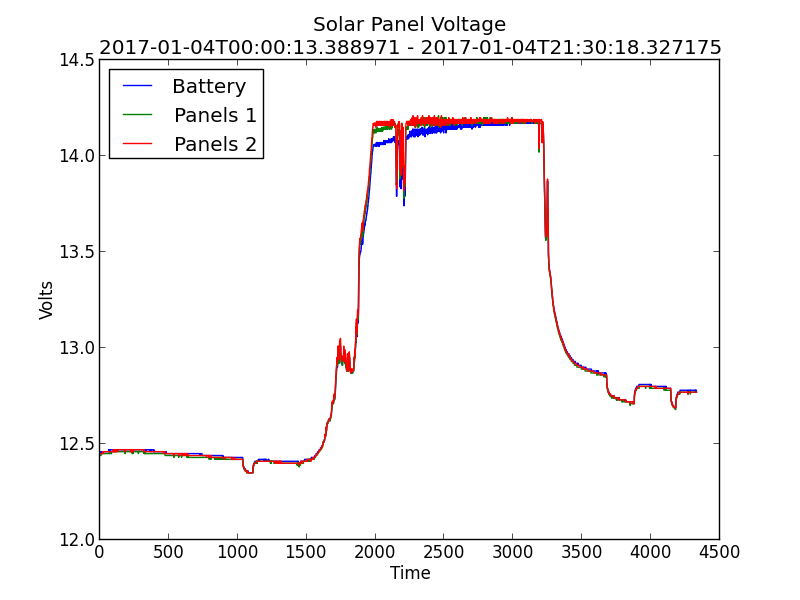
Now my data starts to make sense!

Keep checking back for my next posts, in which, if I actually get around to writing them, will show my solar panel setup in detail (pictures!) and start to explore what exactly is going on in this data!
